Use Graphs in QuickBooks Desktop Pro- Instructions
Use Graphs in QuickBooks Desktop Pro: Video Lesson
This video lesson, titled “How to Use Graphs in Intuit QuickBooks Desktop Pro 2024,” shows how to use graphs in QuickBooks Desktop Pro. This video lesson is from our complete QuickBooks tutorial, titled “Mastering QuickBooks Desktop Pro Made Easy v.2024.”
Overview:
You can use graphs in QuickBooks Desktop Pro to see a visual representation of report data. You can use graphs in QuickBooks Desktop Pro to view your data as either a bar graph or a pie chart. However, the “Budget vs. Actual” and “Net Worth” graphs are exceptions to this rule.
The bar graphs and pie charts are just different ways of presenting the same information you can also view in reports. QuickBooks has six types of graphs that can provide up to 15 different views of your data. The types of graphs available appear in the following table.
| GRAPH NAME: | DESCRIPTION: |
| Income and Expense Graph | Shows both the company’s income and expenses for the date range that you specify. |
| Sales Graph | Shows your company’s sales income for the period that you specify. |
| Accounts Receivable Graph | Shows how much your customers owe your company. |
| Accounts Payable Graph | Shows how much your company owes its vendors. |
| Net Worth Graph | Shows your company’s net worth. |
| Budget vs. Actual Graph | Shows the difference between budgeted and actual amounts earned or spent. |
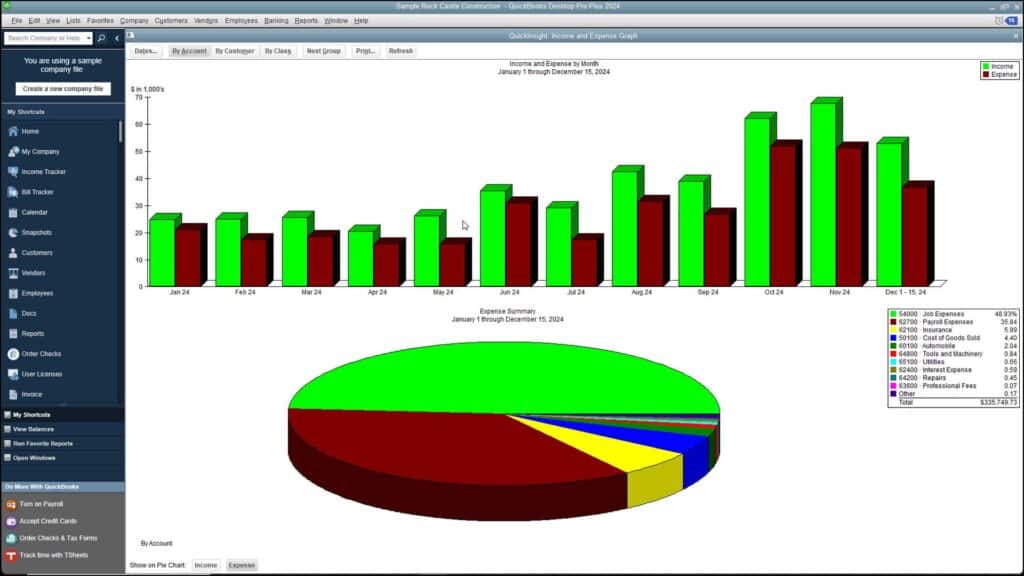
Use Graphs in QuickBooks Desktop Pro- Instructions: A picture of the Income and Expense Graph in QuickBooks Desktop Pro.
The QuickInsight graphs that QuickBooks Desktop Pro produces have several features in common. Every graph, except “Net Worth” and “Budget vs. Actual,” shows a bar graph in the top half of the graph. They also show a pie chart in the bottom half of the graph. The bar graph shows totals of the data, broken down by a specified period. The pie chart shows a summary total of some type of data from the bar graph above it.
Also, every graph comes with a graph toolbar. The toolbar lets you customize the graphs in much the same way as reports. Like reports, you can also use QuickZoom in a graph to see the actual numbers represented by the graph items. This then typically produces summary reports you can continue to QuickZoom to show the transactions summarized by the graph totals.
How to Use Graphs in QuickBooks Desktop Pro: Instructions
- To use graphs in QuickBooks Desktop Pro, click the “Reports” command in the Menu Bar.
- The graphs then appear in the associated report categories under the “Reports” command in the Menu Bar.
- In the desired report category, click the name of the graph to display.
- To change the data shown in the graph, use the toolbar at the top of the graph window.
- To change the date range of the graph data, use the drop-down in the toolbar.
- If you want to view a detailed report for a graph item using QuickZoom, then double-click the graph object.
- Doing this opens another graph or another report which you can then also QuickZoom.