Change the Chart Type in Excel – Instructions
Change the Chart Type in Excel: Video Lesson
This video lesson, titled “Excel for Microsoft 365 Tutorial: How to Change the Chart Type in Excel,” shows you how to change the chart type in Excel. This video lesson is from our complete Excel tutorial, titled Mastering Excel Made Easy™.
Overview
After creating a chart, you can change the chart type in Excel. Alternatively, you can also choose a different sub-type of the same general chart type you first selected. Either way, note that if you change the chart type, you may lose custom formatting you have applied to it. You may also need to reposition custom elements you have added to the chart area.
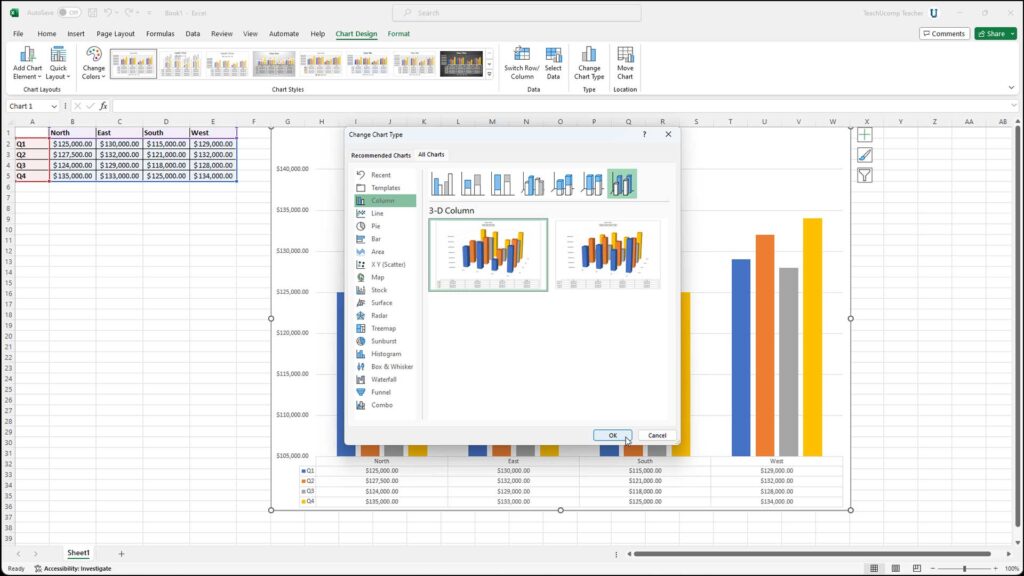
To change the chart type in Excel, select a chart or one of the chart’s elements. Then click the “Chart Design” contextual tab in the Ribbon. Then click the “Change Chart Type” button in the “Type” button group.
In the “Change Chart Type” dialog box that then opens, select a new chart type to apply from the primary chart types that appear in the pane at the left side of the dialog box. When you do that, the different sub-types of the selected chart type then appear in a scrolling list at the right side of the dialog box. Then click the specific chart sub-type to apply. Finally, click the “OK” button at the bottom of this dialog box to change the selected chart type.
Change the Chart Type in Excel: Instructions
- To change the chart type in Excel, select the chart or one of its chart elements.
- Then click the “Change Chart Type” button in the “Type” button group on the “Design” tab of the “Chart Tools” contextual tab in the Ribbon.
- In the “Change Chart Type” dialog box that appears, select the type of chart to use from the various chart types in the pane at the left side of the dialog box.
- When you do that, the different sub-types of the selected chart type appear in the scrolling list at the right side of the dialog box.
- Click the specific chart sub-type to apply.
- Then click the “OK” button at the bottom of this dialog box to change the selected chart type.