Charts in Access – Instructions and Video Lesson
How to Create Charts in Access: Video
This video lesson, titled “Using Charts,” shows how to create, edit, and format Microsoft Graph charts in Access. This video lesson is from our complete Access tutorial, titled “Mastering Access Made Easy v.2019 and 365.”
Overview of How to Create Charts in Access
You can create charts in Access in two different ways if using Access 2019 or Access for Microsoft 365. You can insert new modern charts into your reports in Access or use the older Microsoft Graph chart controls. These are still available for backward-compatibility in Access 2019 and 365. This lesson shows you how to insert the older, Microsoft Graph chart controls in reports in Access. This method is also the one you must use in older versions of Access without modern charts.
You insert all charts in Access as a report control. Unlike other report controls, chart controls use their own data source to chart the data. Therefore, you can insert it into a blank, unassociated report, if desired, by clicking the “Report Design” button in the “Reports” button group on the “Create” tab of the Ribbon.
Before creating this type of chart, enable the “Use Control Wizards” button by clicking the “More” arrow in the lower-right corner of the scrollable list of controls in the “Controls” button group on the “Design” tab of the “Report Design Tools” contextual tab in the Ribbon to show its drop-down menu.
Ensure the “Use Control Wizards” button is highlighted, which means it is enabled. If not highlighted, click the button in the drop-down menu to enable it. This makes it much easier to create a Microsoft Graph chart. However, note that this wizard will not appear if you choose to insert a modern chart in Access.
How to Create a Microsoft Graph Chart in Access
To insert an older, Microsoft Graph chart control into a report in Access, click the “Insert Chart” button in the scrollable list of controls in the “Controls” button group on the “Design” tab of the “Report Design Tools” contextual tab in the Ribbon. Then click and drag over the area in the report you want the chart to cover.
If you enabled the “Use Control Wizards” button, then when you release your mouse button, the “Chart Wizard” dialog box opens. In the first screen of the “Chart Wizard,” select the data source for the chart. You can select either the “Tables,” “Queries,” or “Both” option button to display those types of objects in the list. Then select the name of the table or query to use as the chart’s data source from the listing of tables and/or queries. Then click the “Next >” button to continue.
In the next screen, choose the fields to show in the chart by selecting them from the “Available Fields:” list and then clicking the “>” button to move them into the “Fields for Chart:” list. Then click the “Next >” button to continue. In the next screen, click the type of chart you want to create from the listing of chart types shown. Then click the “Next >” button to continue.
In the next screen, drag and drop fields shown at the right side of the window into the desired chart locations shown at the left side of the window. You can double-click any summary field shown to change the function performed on the field in a separate dialog box, if needed. You can also click the “Preview Chart” button to show a preview of your chart in a separate window. When satisfied with the chart’s appearance, click the “Next >” button to continue.
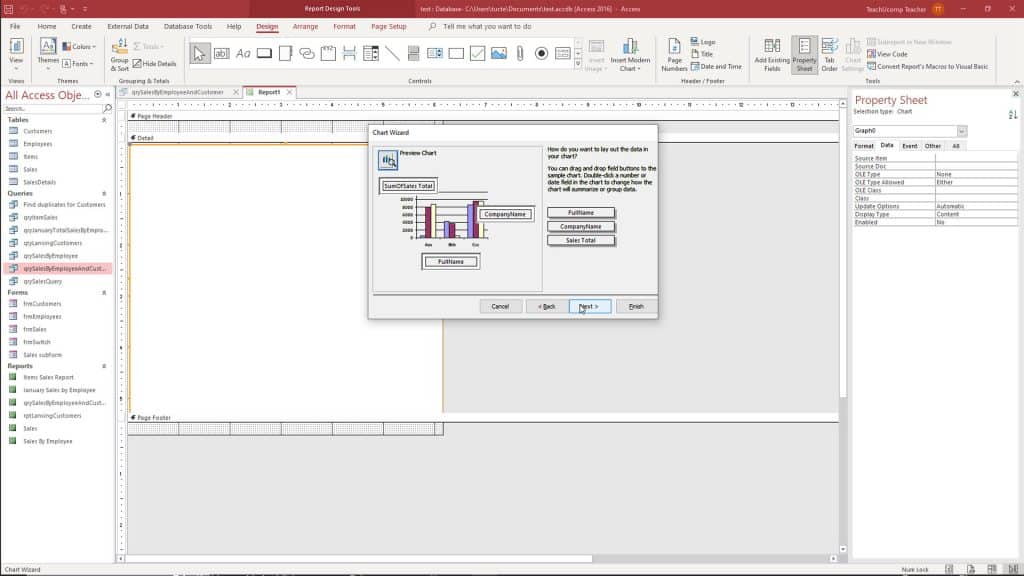
A picture of the “Chart Wizard” that you use to create charts in Access.
In the last screen of the “Chart Wizard,” type a title for your chart into the box provided and then select whether to add a legend to the chart. Then click the “Finish” button to add the chart control to your report. Don’t worry if the chart doesn’t display your data in report design view; it won’t. You must switch to “Layout View” to see the chart’s data and resize the chart control until it appears the way you want it to in the report.
Editing and Formatting Microsoft Graph Charts in Access
Microsoft Graph charts in Access are independent objects that contains many smaller objects that have their own properties, which you can independently format, if desired. When in report design view, you may select the chart control and then view its properties in the “Property Sheet” pane.
The “Row Source” property on the “Data” tab in the pane shows the SQL code of the query upon which the chart is based. If you click into the “Row Source” property box, you can then click the “Builder” button […] that appears at the right end of the box to view the SQL query in the visual query design view, which you can edit, if needed.
To format the chart when using report design view, double-click the chart control to activate the “Microsoft Graph” program. Note that the toolbars change to reflect that fact. The new toolbar that appears lets you format the chart. You can select any chart object and click the buttons in the new toolbar to change its formatting.
The data shown in the “Datasheet” when you edit the chart just shows the most recent data. You do not need to change the datasheet info. After making any formatting changes you want, click back into the blank area of the report to close Microsoft Graph, and switch back to Access.
Instructions on How to Create a Microsoft Graph Chart in Access
- To insert an older, Microsoft Graph chart control into a report in Access, click the “Insert Chart” button in the scrollable list of controls in the “Controls” button group on the “Design” tab of the “Report Design Tools” contextual tab in the Ribbon.
- Then click and drag over the area in the report you want the chart to cover.
- If you enabled the “Use Control Wizards” button, then when you release your mouse button, the “Chart Wizard” dialog box opens.
- In the first screen of the “Chart Wizard,” select the data source for the chart.
- You can select either the “Tables,” “Queries,” or “Both” option button to display those types of objects in the list.
- Then select the name of the table or query to use as the chart’s data source from the listing of tables and/or queries.
- Then click the “Next >” button to continue.
- In the next screen, choose the fields to show in the chart by selecting them from the “Available Fields:” list and then clicking the “>” button to move them into the “Fields for Chart:” list.
- Then click the “Next >” button to continue.
- In the next screen, click the type of chart you want to create from the listing of chart types shown.
- Then click the “Next >” button to continue.
- In the next screen, drag and drop fields shown at the right side of the window into the desired chart locations shown at the left side of the window.
- You can double-click any summary field shown to change the function performed on the field in a separate dialog box, if needed.
- To show a preview of your chart in a separate window, click the “Preview Chart” button.
- Once you are satisfied with the appearance of your chart, click the “Next >” button to continue.
- In the last screen of the “Chart Wizard,” type a title for your chart into the box provided and then select whether to add a legend to the chart.
- Click the “Finish” button to add the chart control to your report.
How to Edit and Format a Microsoft Graph Chart in Access
- After you create a Microsoft Graph Chart in Access, don’t worry if the chart doesn’t show your data in report design view; it won’t. You must switch to “Layout View” to see the chart’s data and resize the chart control until it appears the way you want it to in the report.
- However, when in report design view, you may select the chart control and then view its properties in the “Property Sheet” pane.
- The “Row Source” property on the “Data” tab in the pane shows the SQL code of the query upon which the chart is based.
- If you click into the “Row Source” property box, you can then click the “Builder” button […] that appears at the right end of the box to view the SQL query in the visual query design view, which you can edit, if needed.
- To format the chart when using report design view, double-click the chart control to activate the “Microsoft Graph” program. Note that the toolbars change to reflect that fact.
- The new toolbar that appears lets you format the chart.
- You can select any chart object and click the buttons in the new toolbar to change its formatting.
- The data shown in the “Datasheet” when you edit the chart just shows the most recent data. You do not need to change the datasheet info.
- After making any formatting changes you want, click back into the blank area of the report to close Microsoft Graph and switch back to Access.