TeachUcomp, Inc.

P: 877-925-8080

  • HOME
  • VIDEO COURSES
    • All-Access Subscriptions
    • Business Licensing
    • Course List
      • Adobe
        • Acrobat
        • Lightroom Classic
        • Photoshop
        • Photoshop Elements
      • Crystal Reports
      • Employment Skills
        • Interview Skills
        • Resume Skills
      • For Lawyers
        • Excel for Lawyers
        • Outlook for Lawyers
        • QuickBooks for Lawyers
        • Word for Lawyers
      • HTML
      • JavaScript
      • Microsoft Office
        • Access
        • Excel
        • Microsoft Office Suite
        • OneNote
        • Outlook
        • Outlook on the Web
        • PowerPoint
        • Publisher
        • Word
      • Microsoft Project
      • Microsoft Teams
      • QuickBooks Online
      • QuickBooks Pro
      • Sage
        • Peachtree
        • Sage 50
      • SQL
      • Windows
    • Video Course Options
  • SUBSCRIPTIONS
  • MANUALS
    • Adobe
      • Acrobat
      • Lightroom Classic
      • Photoshop
      • Photoshop Elements
    • Crystal Reports
    • For Lawyers
      • Excel for Lawyers
      • Outlook for Lawyers
      • QuickBooks for Lawyers
      • Word for Lawyers
    • HTML
    • JavaScript
    • Microsoft Office
      • Access
      • Excel
      • OneNote
      • Outlook
      • Outlook on the Web
      • PowerPoint
      • Publisher
      • Word
    • Microsoft Project
    • Microsoft Teams
    • QuickBooks Online
    • QuickBooks Pro
    • Sage
      • Peachtree
      • Sage 50
    • SQL
    • Windows
  • REFERENCE CARDS
    • Adobe
      • Acrobat DC
      • Lightroom Classic CC 2018
      • Photoshop 2021
      • Photoshop 2020
      • Photoshop CC 2018
      • Photoshop Elements 2022
      • Photoshop Elements 2021
      • Photoshop Elements 2020
      • Photoshop Elements 2019
      • Photoshop Elements 2018
      • Photoshop Elements 15
    • Google
      • Google Classroom for Teachers
      • Google Docs
      • Google Drive
      • Google Forms
      • Google Sheets
    • Microsoft Office
      • Microsoft Office 365
        • Access for Office 365
        • Excel for Office 365
        • Microsoft Office 365
        • Outlook for Office 365
        • PowerPoint for Office 365
        • Publisher for Office 365
        • Word for Office 365
      • Microsoft Office 2021
        • Access 2021
        • Excel 2021
        • Microsoft Office 2021
        • Outlook 2021
        • PowerPoint 2021
        • Publisher 2021
        • Word 2021
      • Microsoft Office 2019
        • Access 2019
        • Excel 2019
        • Microsoft Office 2019
        • Outlook 2019
        • PowerPoint 2019
        • Publisher 2019
        • Word 2019
      • Microsoft Office 2016
        • Access 2016
        • Excel 2016
        • Microsoft Office 2016
        • OneNote 2016
        • Outlook 2016
        • PowerPoint 2016
        • Publisher 2016
        • Word 2016
      • Microsoft Office 2013
        • Excel 2013
        • Microsoft Office 2013
        • OneNote 2013
        • Outlook 2013
        • PowerPoint 2013
        • Word 2013
      • Microsoft Office for iPad
        • Microsoft Office for iPad
    • Microsoft Teams
      • Microsoft Teams
    • QuickBooks Online
      • QuickBooks Online
    • QuickBooks Pro
      • QuickBooks Pro 2022
      • QuickBooks Pro 2021
      • QuickBooks Pro 2020
      • QuickBooks Pro 2019
      • QuickBooks Pro 2018
      • QuickBooks Pro 2017
      • QuickBooks Pro 2016
      • QuickBooks Pro 2015
      • QuickBooks Pro 2014
    • Sage
      • Sage 50 2019
      • Sage 50 2018
    • SQL
      • SQL
    • Windows
      • Windows 11
      • Windows 10
  • STICKERS
    • Chrome OS
      • Chrome OS for Chromebooks
    • Mac OS
      • Mac OS Monterey-Mojave
    • QuickBooks Desktop
      • QuickBooks Desktop 2022-2015
    • Windows
      • Windows 11 and 10
  • SUPPORT
    • Company
      • About Us
      • Blog
      • Contact Us
      • Our History
      • Our Philosophy
        • Customer Service
        • Mission
      • Policies
      • Testimonials
    • Contact Us
    • FAQ
    • Help
    • Lost Password
    • Register a Product
  • LOGIN
    • Manage My Account
    • Member Login
    • My Courses
  • CART
Shop Now

Creating Basic Reports in Project 2013

by Keeley Byrnes / Wednesday, August 28 2013 / Published in Latest


Starting in Project 2013, there are many improvements to the reporting capabilities of Microsoft Project. You can create a report in Project 2013 by clicking the “Report” tab within the Ribbon and then clicking on the type of report that you want to create within the “View Reports” and “Export” button groups.

If you select a report type within the “View Reports” button group, you will then need to select the name of the report that you want to create from the drop-down menu that appears.


Slide1


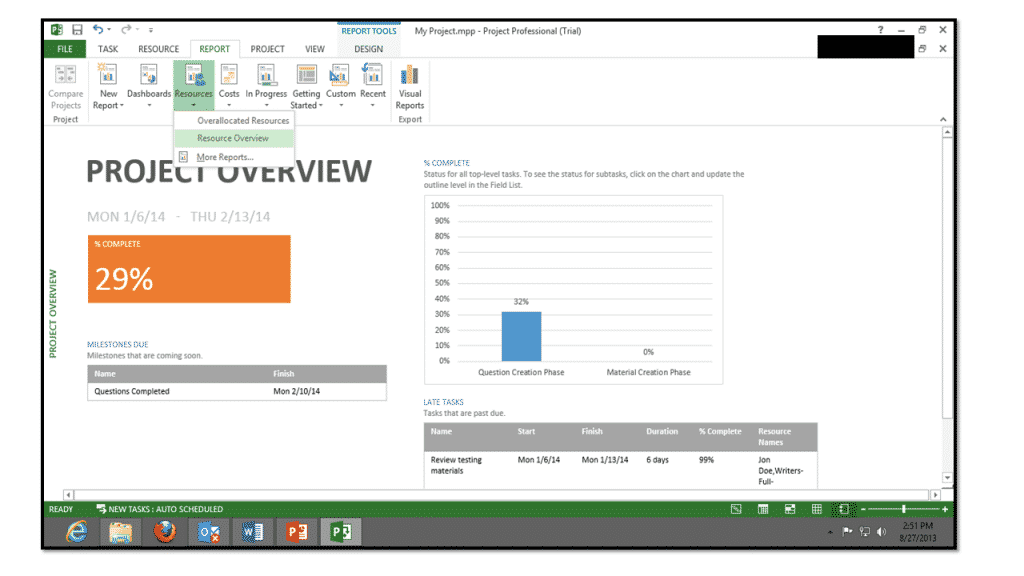
There are many new preset reports that appear within Project 2013. Below is a listing of the names of the preset reports within Project 2013 and their use within a project file. These reports are grouped by report category.


Report Category: Dashboard Reports
Report Name: Description:
Burndown Shows the amount of work, tasks completed, and work remaining.
Cost Overview Shows the current cost status of your project. Displays planned costs, remaining costs, actual costs, cumulative costs, baseline costs and percent complete. Used to determine if the project will stay within its budget.
Project Overview Shows how much of your project is complete, upcoming milestones, and any late tasks.
Upcoming Tasks Shows the current week’s work, the status of remaining tasks that were due, and the tasks that are scheduled to start in the next week.
Work Overview Shows a work burndown for your project and the work stats for all top-level tasks so you will know the percentage of completion and what work is remaining.
Report Category: Resource Reports
Report Name: Description:
Overallocated Resources Shows the work status for overallocated resources, including actual and remaining work. Used to aid you in resolving resource overallocations.
Resource Overview Shows the work status of all work resources on the project. Used to determine the work completed and work remaining on a project.
Report Category: Cost Reports
Report Name: Description:
Cash Flow Shows costs and cumulative costs per quarter for all top-level tasks. Can be modified to show various costs and alternate time periods.
Cost Overruns Shows cost variance for all top-level tasks and work resources. Used to show where actual costs are exceeding baseline costs.
Earned Value Report Shows the earned value, variance, and performance indicators over time by comparing costs and schedules to a baseline. Used to determine if your project is on track when compared to a selected baseline.
Resource Cost Overview Shows the cost status of work resources and material resources. Shows cost details in a table and cost distribution in a chart.
Task Cost Overview Shows the cost status of top-level tasks. Shows cost details in a table and cost distribution in a chart.
Report Category: Progress Reports
Report Name: Description:
Critical Tasks Shows all tightly scheduled tasks that are listed as critical on your project’s critical path. These are tasks that, if delayed, will cause the schedule to slip.
Late Tasks Shows all tasks that start or finish later than their scheduled start or finish dates.
Milestone Report Shows the status of all milestone tasks within a project file.
Slipping Tasks Shows all tasks that are behind schedule with a finish date later than the finish date within a selected comparison baseline.
Report Category: Custom Report Template Types
Report Name: Description:
Blank A blank report that you can completely customize.
Chart A chart for your project showing actual work, remaining work, and work by default.
Table A table for your project data, showing the “Name,” “Start,” “Finish,” and “% Complete” fields. You can customize the fields shown.
Comparison Shows two charts side-by-side, showing the same project data. Pick the fields you want to show in one chart side-by-side to compare them to the other.

Tagged under: 2013, basic, create, help, how-to, microsoft, office, project, reporting, reports

About Keeley Byrnes

Keeley is our Director of Marketing and has been with TeachUcomp since 2010. Keeley manages all aspects of our Marketing Department, acts as liaison for our reseller and affiliate partners and also authors courses in software and taxation.

What you can read next

Insert Audio and Videos into OneNote Pages- Tutorial: Pictures of the “Playback” tab in the “Audio & Video” contextual tab in the Ribbon of OneNote 2016 and the “Playback” Mini Toolbar.
Insert Audio and Videos into OneNote Pages- Tutorial
Transitions in CSS3- Tutorial: A picture of a transition in CSS3 that is used to change the appearance of a DIV tag in an HTML5 page.
Transitions in CSS3- Tutorial
A picture of our new product release, “Microsoft Excel 2013 Introductory Quick Reference Guide.
Buy Excel Quick Reference Cards at TeachUcomp, Inc.


Recent Posts

  • A picture showing how to manage libraries in Windows 11.

    Libraries in Windows 11 – Instructions

    How to Show Libraries in Windows 11            ...
  • A picture showing how to cut, copy, and paste files and folders in Windows 11 by dragging and dropping them between File Explorer windows.

    How to Cut, Copy, and Paste Files and Folders in Windows 11 – Instructions

    Overview of How to Cut, Copy, and Paste Files a...
  • A picture showing how to rename files and folders in Windows 11 using File Explorer.

    How to Rename Files and Folders in Windows 11 – Instructions

    Overview of How to Rename Files and Folders in ...

Categories

Archives

  • GET SOCIAL

© 2001-2022 Copyright TeachUcomp, Inc. All rights reserved.

TOP
Sale! $49 All-Access 0 Days 12 Hours 36 Minutes 56 Seconds      $199 $49 Entire Library!
See Deal