You can insert sparklines into your worksheets to illustrate changes to data values within a column or row of contiguous worksheet cells. A sparkline is basically a mini-chart that appears within a single selected worksheet cell and displays selected cell values as a trendline, columns, or a win-loss series.
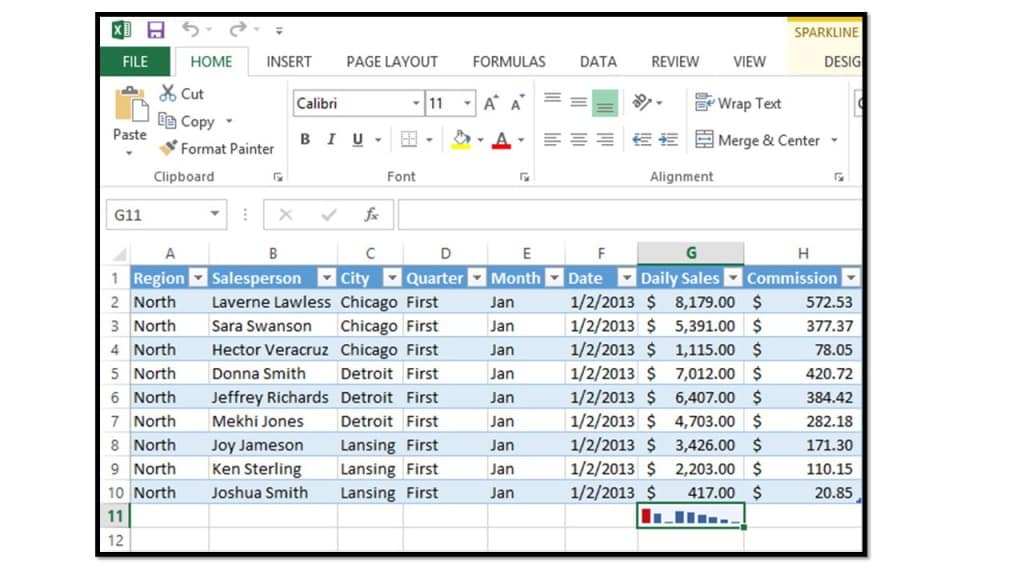
To create a sparkline within a cell, first select the cell within which you want the sparkline to appear. Often this will be the cell at the end of a column or row of data values which you want to illustrate visually.

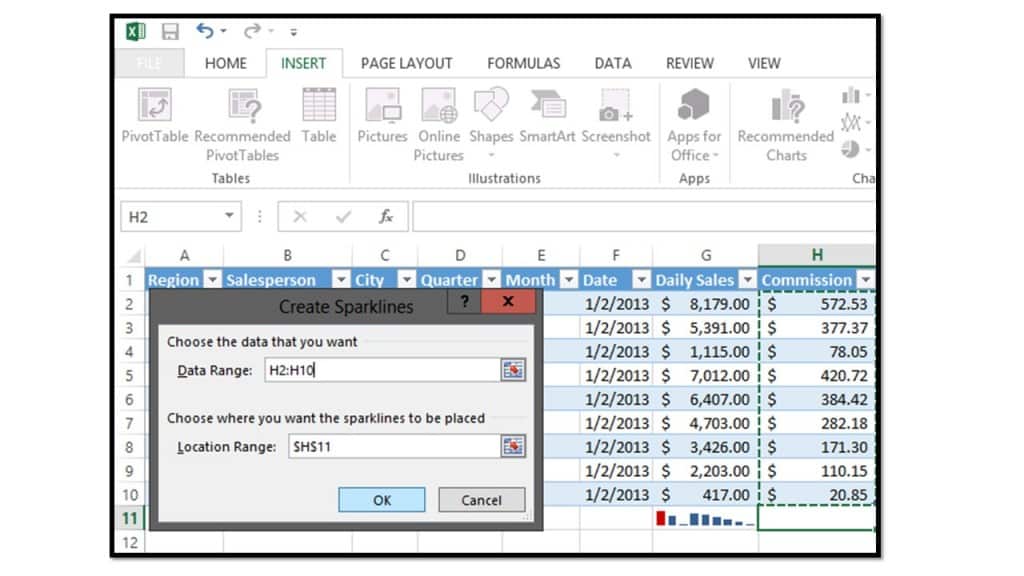
Then click the desired type of sparkline to insert into the cell by clicking either the “Line,” “Column,” or “Win/Loss” button within the “Sparklines” button group on the “Insert” tab within the Ribbon. In the “Create Sparklines” dialog box that then appears, click into the “Data Range” field. Then click and drag over the cells within the worksheet whose values you wish to illustrate within the sparkline. Note that the cells you select that contain the values to show within the sparkline need to be adjacent to each other and in the order that you want them to be displayed within the sparkline. After selecting the cells, you should note that the “Location Range” field will display a reference to the initially selected cell within the worksheet. This is the cell that will contain the sparkline. You can change this value, if needed. Once you have made your selections, click the “OK” button within the dialog box to insert a sparkline of the selected type into your worksheet.
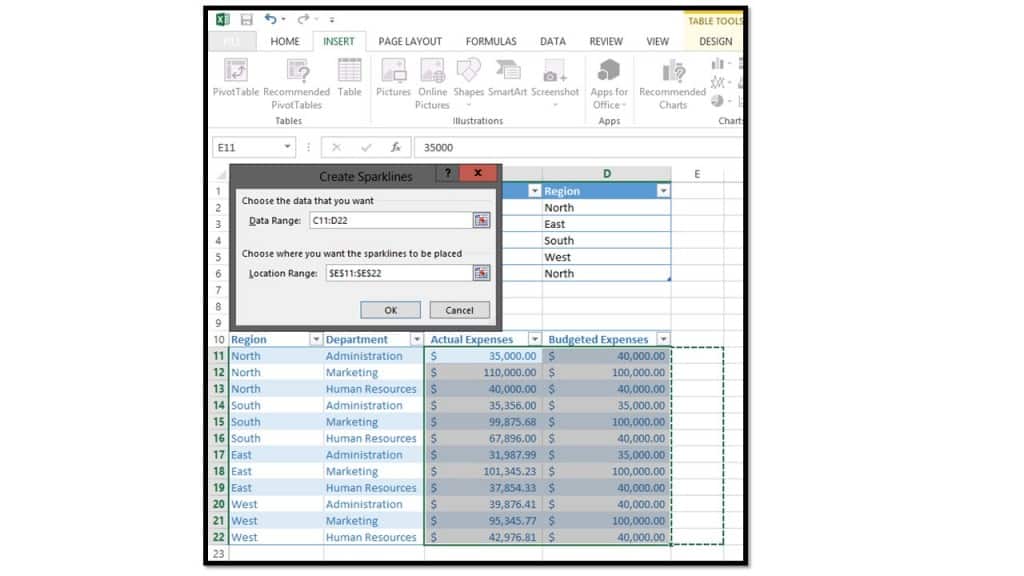
Another way to create sparklines within a worksheet is to first select the cells that contain the values that you want to illustrate within the sparkline. Then click either the “Line,” “Column,” or “Win/Loss” button within the “Sparklines” button group on the “Insert” tab within the Ribbon. Within the “Create Sparklines” dialog box, you can then click into the “Location Range” field and then select the cell range within the worksheet where you want the sparklines of the initially selected data to appear. You can then click the “OK” button to insert multiple sparklines, called a sparkline group, for the selected data into the chosen location.
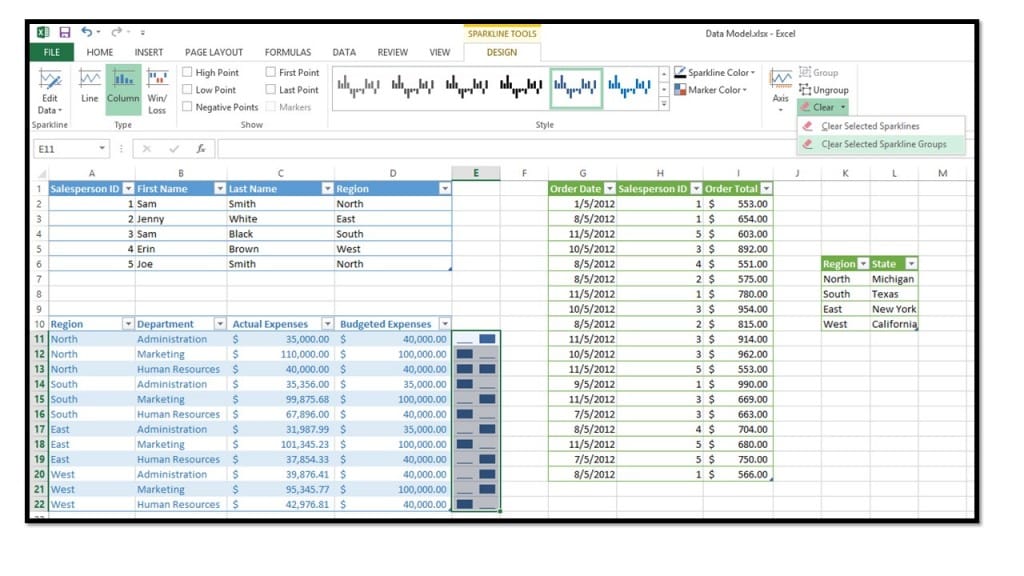
To delete sparklines, select a sparkline to delete. Then click the “Design” tab within the “Sparkline Tools” contextual tab within the Ribbon. Then click the drop-down button at the right of the “Clear” button within the “Group” button group. From the drop-down menu that appears, you can select either the “Clear Selected Sparklines” to delete the selected sparkline or choose the “Delete Selected Sparkline Group” command to delete the selected sparkline group. Note that simply clicking the “Clear” button directly will only delete the selected sparkline, not the entire group.