How to View the Business Snapshot Graphs in QuickBooks Online
How to View the Business Snapshot Graphs in QuickBooks Online: Video
This video lesson, titled “How to View the Business Snapshot Graphs in QuickBooks Online,” shows you how to view the Business Snapshot graphs in QuickBooks Online. This video lesson is from our complete QuickBooks Online tutorial, titled “Mastering QuickBooks Online Made Easy.”
Overview:
The Business Snapshot report in QuickBooks Online is a group of graphs that lets you quickly see your company’s income and expenses. To open the Business Snapshot in QuickBooks Online, hover over the “Reports” button in the Navigation Bar and then click the “Standard reports” link or click the “Standard reports” link in the “Reports & Analytics” bar if that bar already appears onscreen. Either way, the “Standard reports” page then appears to the right.
Next, click the “Business Snapshot” link within the “Business overview” report category in the “Standard reports” page. Alternatively, click into the “Type report name here” field in the “Standard reports” page, type “Business Snapshot,” and then click to select it from the list of reports that appears below the field.
Which Graphs Appear in the Business Snapshot?
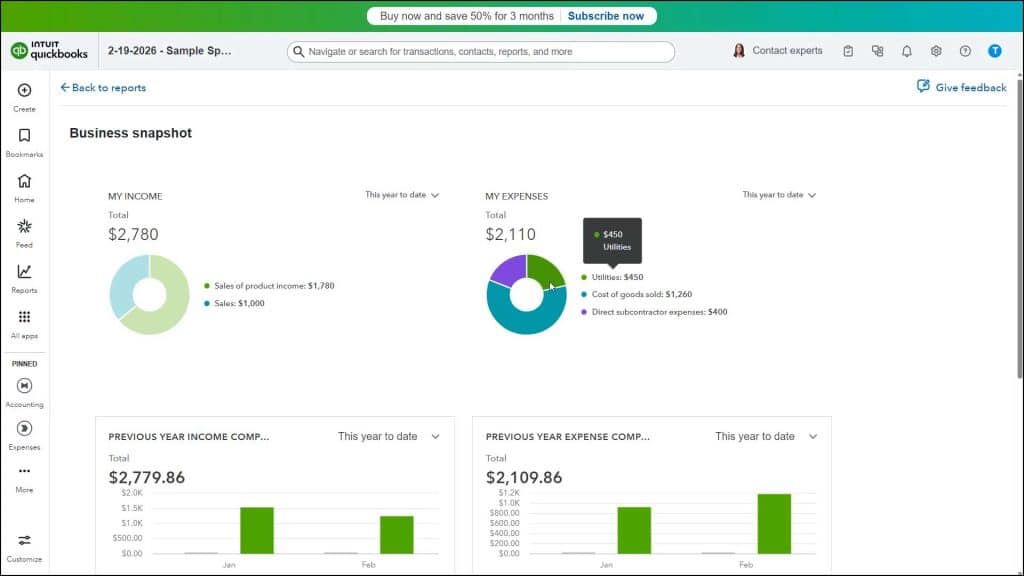
The Business Snapshot in QuickBooks Online shows the “My Income” and “My Expenses” graphs, which show a breakdown of your income and expenses by account. It then also shows a “Previous Year Income Comparison” graph and a “Previous Year Expense Comparison” graph.
At the bottom of the report, the “Who Owes Me” list shows customers who currently owe you money. The “Who I Owe” list shows the vendors to whom you currently owe money. The default period for all the graphs and lists is “This Year-to-date.”
How to Use the Business Snapshot Graphs in QuickBooks Online:
To change the period shown in one of the graphs or lists, select a choice from the drop-down in its upper-right corner. To show the amount for any account category in either the “My Income” or “My Expenses” graph, hover over the desired account or its section in the graph to show a screen tip that shows the amount. To show the amount for any bar in the “Previous Year Income Comparison” graph or “Previous Year Expense Comparison” graph, hover over the bar.
How to Export the Graphs as PDFs or View Associated Graph Reports:
To export and download a PDF for either the “Previous Year Income Comparison” graph or “Previous Year Expense Comparison” graph, hover over the graph, click the triple-dot icon that then appears in its lower-right corner, and select the “Export widget” command. To view the previous year profit and loss comparison report, click the “Go to report” link in either graph. To view the associated “A/R Aging Summary Report” or “A/P Aging Summary Report” report for the “Who Owes Me” or the “Who I Owe” lists, click the “Go to report” link at the bottom of the respective graph.
How to Print the Business Snapshot Graphs:
If desired, you can print the entire “Business Snapshot” page in your browser window by using your web browser’s “Print” feature to print the entire page. How you do this varies, based on the web browser you are using.