General Report Settings in QuickBooks Online
General Report Settings in QuickBooks Online: Video
This video lesson, titled “How to Customize the General Report Settings in QuickBooks Online,” shows you how to change the most common, general report settings in QuickBooks Online. This video lesson is from our complete QuickBooks Online tutorial, titled “Mastering QuickBooks Online Made Easy.”
Overview:
Where Are the General Report Settings in QuickBooks Online?
The general report settings in QuickBooks Online appear in the report customization settings section at the top of the report after you run a standard report. Note that these settings will change, depending on the specific report, but many of these settings are common to all reports, too. This lesson reviews the most common general report settings you will see in this report customization settings section in QuickBooks Online.
How to Change Date Range of Data Shown in a Report:
To change the date range of data shown in the report, select a choice from the “Report period” drop-down in the report customization settings section above the report to select from common date ranges. Alternatively, to select a specific start date and an ending date range for reports that use a date range, select choices from the adjacent “From” and “To” calendar drop-down fields. Alternatively, to select a single date as of which to show the data for reports that show data as of a date, select a date from the adjacent “as of” calendar drop-down.
How to Change the Report’s Accounting Method:
To change the accounting method the report uses within reports that show data based on an accounting method, select either the “Cash” or “Accrual” toggle switch button. This only changes the report’s data and has no bearing on the data recorded in QuickBooks Online or the accounting method you use for tax purposes.
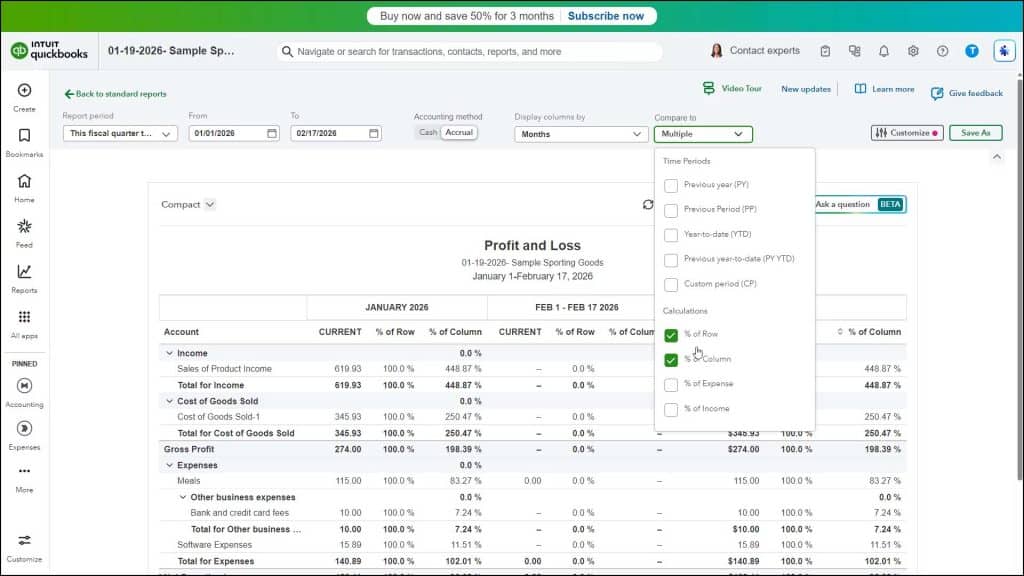
How to Change the Columns and Comparison Calculations in Summary Reports:
To add columns to a summary report by which to view the totals for each row in a summary report which shows an aggregation of values, or totals, select a choice from the “Display columns by” drop-down that appears in the report customization settings section.
To then change the comparison columns and comparison calculation values in a summary report, click the adjacent “Compare to” drop-down in this same section. To add or remove columns for comparison, check or uncheck the desired checkboxes in the “Time Periods” section of the drop-down menu that appears. To also add columns showing the change in dollar amounts or percentages for the columns or rows in the summary report, check the desired checkboxes under the “Calculations” section of this same drop-down menu.
How to Show Non-zero or Active Column and Row Values:
Relatedly, to select which column and row values to show in the report, based on account activity or non-zero amounts if customizing a summary report, click the “Customize” button in the report customization settings section to show the “Customize” pane at the right side of the report window. Then click the “Show non-zero or active” section in the “Customize” pane that appears. Finally, choose either the “Active,” “All,” or “Non-zero” option button for the “Show rows” and “Show columns” settings.
How to Change the Number Format Shown in Reports:
Also, note you can also change the general display of numbers in both summary and details reports in QuickBooks Online by clicking the “Number format” section in the “Customize” pane in a report and then changing its settings. To choose how numbers appear in the report, check or uncheck the “Divide by 1000” or “Round to the nearest whole number” checkbox. To choose how to show negative number values in the report, select a choice from the “Negative numbers” drop-down. To show negative numbers in red, check the “Show in red” checkbox.