Move a Chart in Excel- Instructions
Move a Chart in Excel: Video Lesson
This video lesson, titled “Excel for Microsoft 365 Tutorial: How to Move and Resize Charts in Excel,” shows you how to move a chart in Excel. This video lesson is from our complete Excel tutorial, titled Mastering Excel Made Easy™.
Overview
You can easily move a chart in Excel. When you insert a new chart into an Excel worksheet, it appears as an embedded chart object within the worksheet. When a chart is embedded in an Excel worksheet, you can move it around within the worksheet and also resize it.
Before you do this, however, first ensure you select the Chart Area. To select the Chart Area of a chart in Excel before you move or resize it, either click into the blank area of the chart object to select the entire chart or select the “Chart Area” choice from the “Chart Elements” drop-down in the “Current Selection” button group on the “Format” contextual tab in the Ribbon.
To then move the embedded chart in Excel, click and drag inside the Chart Area of the chart. The mouse pointer appears as a four-pointed arrow while moving the chart. When the chart is in the desired location in the worksheet, release the mouse button to drop the chart into its new worksheet location.
To resize the embedded chart in Excel, place your mouse pointer over one of the white resizing circles that appear at the four corners and four sides of the selected chart object’s border. Hover over the circle that corresponds to the direction in which to resize the chart. The mouse pointer should become a double-pointed arrow when placed into one of the correct positions. At that point, then click and drag to resize the chart area to the desired width and height within the worksheet.
Alternatively, to instead show a selected chart as the only object within its own worksheet in Excel or move an embedded chart to a different worksheet but keep it as an embedded object within the worksheet, first select the Chart Area of the chart, as mentioned above. Then click the “Move Chart” button in the “Location” button group on the “Chart Design” contextual tab in the Ribbon. Doing this then opens the “Move Chart” dialog box, which lets you decide where to place the chart.
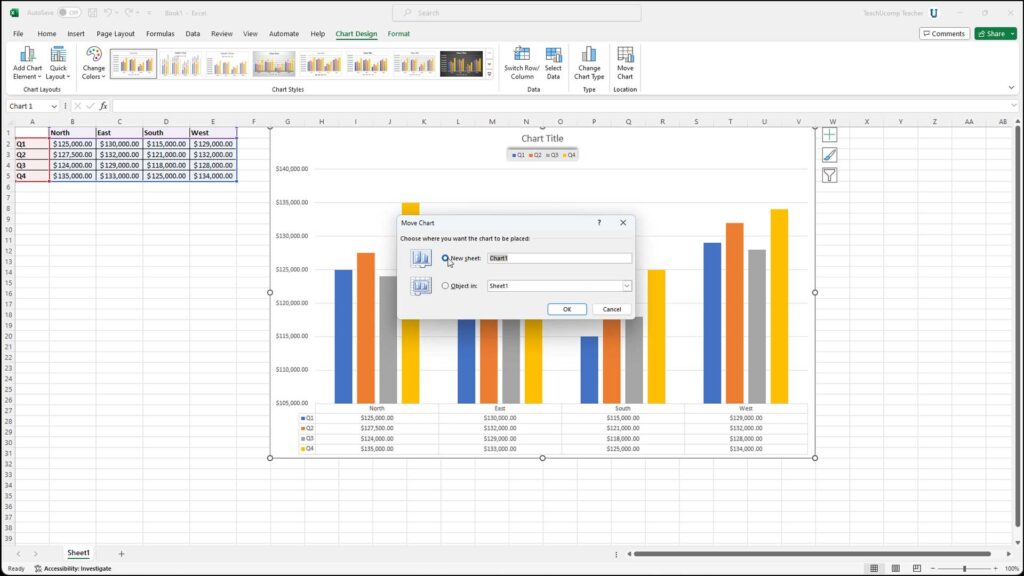
To move the chart to a new worksheet in Excel and make it the only object in the worksheet, select the “New sheet:” option. Then type the name for the new worksheet into the field to the right of the option button. This maximizes the amount of space available for plotting its chart data.
Alternatively, to move the chart and place it into an existing Excel worksheet as an embedded chart object, select the “Object in:” option button. Then use the drop-down to the right of that option button to select the name of the worksheet into which to embed the selected chart. After making your choice in this dialog box, then click the “OK” button to move the chart to the desired location.
Move a Chart in Excel: Instructions
- To select the Chart Area of a chart in Excel before you move or resize it, click into the blank area of the chart object to select the entire chart or select the “Chart Area” choice from the “Chart Elements” drop-down in the “Current Selection” button group on the “Format” contextual tab in the Ribbon.
- To then move the embedded chart in Excel, click and drag inside the Chart Area of the chart.
- The mouse pointer appears as a four-pointed arrow while moving the chart.
- When the chart is in the desired location in the worksheet, release the mouse button to drop the chart into its new worksheet location.
- To resize the embedded chart in Excel, place your mouse pointer over one of the white resizing circles that appear at the four corners and four sides of the selected chart object’s border.
- Hover over the circle that corresponds to the direction in which to resize the chart.
- The mouse icon should become a double-pointed arrow when placed into one of the correct positions.
- Then click and drag to resize the chart area to the desired width and height within the worksheet.
- Alternatively, to instead show a selected chart as the only object within its own worksheet in Excel or move an embedded chart to a different worksheet but keep it as an embedded object within the worksheet, first select the Chart Area of the chart, as mentioned above.
- Then click the “Move Chart” button in the “Location” button group on the “Chart Design” contextual tab in the Ribbon to open the “Move Chart” dialog box.
- To move the chart to a new worksheet in Excel and make it the only object in the worksheet, select the “New sheet:” option.
- Then type the name for the new worksheet into the field to the right of the option button.
- Alternatively, to move the chart and place it into an existing Excel worksheet as an embedded chart object, select the “Object in:” option button.
- Then use the drop-down to the right of that option button to select the name of the worksheet into which to embed the selected chart.
- After making your choice in this dialog box, then click the “OK” button to finish moving the chart.