Report Tables in Project 2013 – Tutorial
Report Tables in Project 2013: Video Lesson
This video lesson, titled “Using Report Tables,” shows you how to use report tables in Project 2013. This video lesson on how to use report tables in Project 2013 is from our complete Microsoft Project training, titled “Mastering Project Made Easy v.2013-2010.”
Report Tables in Project 2013: Overview
Report tables in Project 2013 differ from tables in other Office applications, like Word, in that you cannot manually add information to them. Report tables in Project 2013 simply display selected information about the project. Report tables in Project 2013 use a data source for their display of data, much like a chart does. If you wish to add text of your own into a report, then you should insert a “Text Box” or “Shape” to which you can then add text of your choosing.
You can click a table to select the table. When a table is selected, it will appear with a border surrounding it. You should see the “Field List” task pane appear at the right side of the window, as well as the “Design” and “Layout” tabs of the “Table Tools” contextual tab appear within the Ribbon. You can click into the blank area of the report to de-select a table.
To move report tables in Project 2013, click the border of a table at any place where there is not a white square and then drag and drop the table to a new location. To resize report tables in Project 2013, place your mouse pointer over one of the white squares on the border that corresponds to the direction in which you want to resize the table, and then click and drag until the table is the desired size. Then release the mouse button to resize the table. You can resize the columns within a table to accommodate the width of their entries. To do this, simply click and drag the right border of the column whose width you want to adjust to the left or right. You can also click and drag the borders between the rows of the table up or down to decrease or increase the row height. To automatically adjust the width of a column to its widest entry, double-click the right column border to automatically widen or shorten the column. This is useful for adjusting the width of the right-most column in a table, which can otherwise be difficult to adjust due to its proximity to the right border of the entire table.
To change the display of data in report tables in Project 2013, use the “Field List” pane at the right side of the application window when a table is selected. First, select either the “Tasks” or “Resources” command at the top of the pane to choose which set of fields to display within the “Select Fields” section of the pane. You can then check the checkboxes next to the names of the fields within the “Select Fields” section of the task pane that you want to show within the columns of the table. You can uncheck any checkboxes for fields whose display you want to remove. The names of the displayed fields will be shown in a list at the bottom of the “Select Fields” section. The order that they appear from top to bottom is the order in which they will appear from left to right within the table. You can click and drag the names of the fields within this list to change the order of their display within the table.
At the bottom of the task pane, you will see sorting and grouping options for the selected categories above. You can make a choice from the “Filter” drop-down to apply a filter to the selected task or resource fields. You can use the “Group By” drop-down to create a grouping of those fields by type, if desired. You can use the “Outline Level” drop-down to select which level of detail of tasks you wish to show. You can check the “Show hierarchy” checkbox to display the hierarchy of tasks, if desired. You can use the “Sort By” drop-down to select a sorting order of the data within the table.
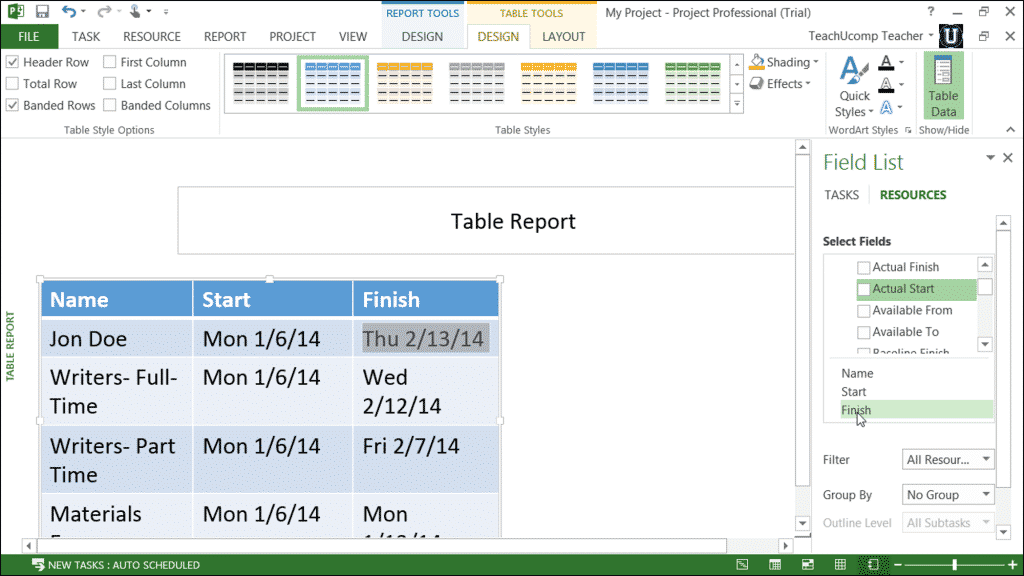
Report Tables in Project 2013 – Tutorial: A picture of a report table and its associated Field List pane in Microsoft Project 2013.
Report Tables in Project 2013: Instructions
- To select report tables in Project 2013, click a table in a report.
- When a table is selected, it will appear with a border surrounding it. You should see the “Field List” task pane appear at the right side of the window, as well as the “Design” and “Layout” tabs of the “Table Tools” contextual tab appear within the Ribbon.
- To de-select report tables in Project 2013, click into the blank area of the report.
- To move report tables in Project 2013, click the border of a table at any place where there is not a white square and then drag and drop the table to a new location.
- To resize report tables in Project 2013, place your mouse pointer over one of the white squares on the border of a table that corresponds to the direction in which you want to resize the table, and then click and drag until the table is the desired size. Then release the mouse button to resize the table.
- To resize the columns within report tables in Project 2013 to accommodate the width of their entries, click and drag the right border of the column whose width you want to adjust to the left or right.
- To decrease or increase the row height within report tables in Project 2013, click and drag the borders between the rows of the table up or down.
- To automatically adjust the width of a column to its widest entry, double-click the right column border to automatically widen or shorten the column.
- To change the display of data within report tables in Project 2013, use the “Field List” pane at the right side of the application window when a table is selected.
- Select either the “Tasks” or “Resources” command at the top of the pane to choose which set of fields to display within the “Select Fields” section of the pane.
- Check the checkboxes next to the names of the fields within the “Select Fields” section of the task pane that you want to show within the columns of the table.
- Uncheck any checkboxes for fields whose display you want to remove.
- The names of the displayed fields will be shown in a list at the bottom of the “Select Fields” section. The order they appear from top to bottom is the order in which they will appear from left to right within the table.
- To change the order of their display within the table, click and drag the names of the fields within this list.
- At the bottom of the task pane, you will see sorting and grouping options for the selected categories above.
- To apply a filter to the selected task or resource fields, make a choice from the “Filter” drop-down.
- To create a grouping of those fields by type, if desired, use the “Group By” drop-down.
- To select which level of detail of tasks you wish to show, use the “Outline Level” drop-down.
- To display the hierarchy of tasks, if desired, check the “Show hierarchy” checkbox.
- To select a sorting order of the data within the table, use the “Sort By” drop-down.
