The Audit Log in QuickBooks Online – Instructions
Thursday, June 24 2021
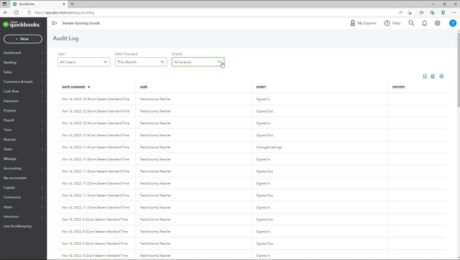
The Audit Log in QuickBooks Online: Video Lesson This video lesson, titled “Using the Audit Log,” shows you how to use the audit log in QuickBooks Online. This video lesson is from our complete QuickBooks Online tutorial, titled “Mastering QuickBooks Online Made Easy.” The Audit Log in QuickBooks Online: Overview The audit log
- Published in Latest, Quickbooks Online
Use Search Folders in Outlook- Instructions and Video
Monday, March 01 2021
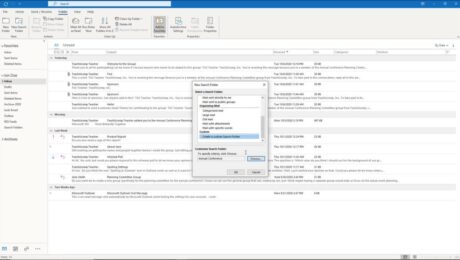
Use Search Folders in Outlook: Video Lesson This video lesson, titled “Creating Search Folders,” shows how to use search folders in Outlook. This video lesson is from our complete Outlook tutorial, titled “Mastering Outlook Made Easy v.2019 and 365.” Use Search Folders in Outlook: Overview You can use search folders in Outlook to
- Published in Latest, Microsoft, Office 2013, Office 2016, Office 2019, Office 365, Outlook 2013, Outlook 2016, Outlook 2019, Outlook for Office 365
The Activity Feed in Teams – Instructions
Thursday, December 10 2020
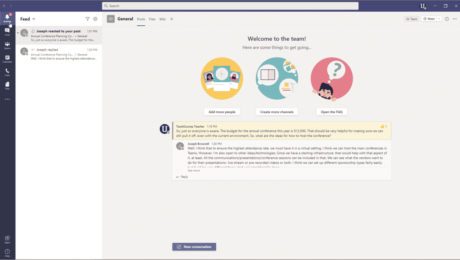
The Activity Feed in Teams: Video Lesson This video lesson, titled “Viewing and Managing the Activity Feed,” shows you how to view and use the Activity feed in Teams. This video lesson is from our complete Teams tutorial, titled “Mastering Teams Made Easy.” The Activity Feed in Teams: Overview The Activity feed in
- Published in Latest, Microsoft, Microsoft Teams, Office 365
Use a Top 10 AutoFilter in Excel – Instructions
Friday, September 20 2019
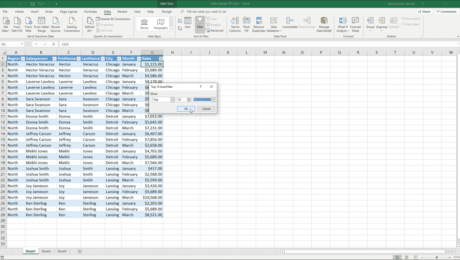
Use a Top 10 AutoFilter in Excel: Video Lesson This video lesson, titled “Using the Top 10 AutoFilter,” shows you how to use a Top 10 AutoFilter in Excel. This video lesson is from our complete Excel tutorial, titled “Mastering Excel Made Easy v.2019 and 365.” Use a Top 10 AutoFilter in Excel: Overview
- Published in Excel 2013, Excel 2016, Excel 2019, Excel for Office 365, Latest, Microsoft, Office 2013, Office 2016, Office 2019, Office 365
The Field List in Report Charts in Project – Tutorial
Friday, July 08 2016
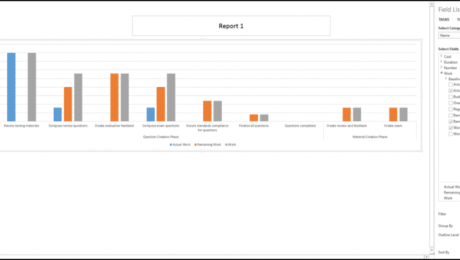
The Field List in Report Charts in Project: Video Lesson This video lesson, titled “Using the Field List with Report Charts,” shows how to use the Field List in report charts in Project. This video lesson is from our complete Project training, titled “Mastering Project Made Easy v.2013-2010.” The Field List in Report Charts
- Published in Latest, Microsoft, Project 2013
Report Tables in Project 2013 – Tutorial
Monday, January 04 2016
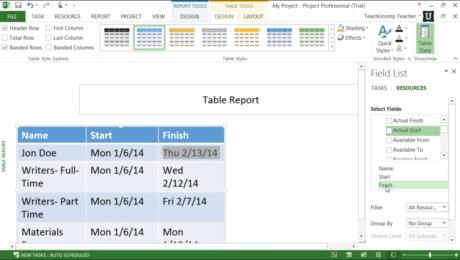
Report Tables in Project 2013: Video Lesson This video lesson, titled “Using Report Tables,” shows you how to use report tables in Project 2013. This video lesson on how to use report tables in Project 2013 is from our complete Microsoft Project training, titled “Mastering Project Made Easy v.2013-2010.” Report Tables in Project 2013:
- Published in Latest, Microsoft, Office 2013, Project 2013

