The Field List in Report Charts in Project – Tutorial
Friday, July 08 2016
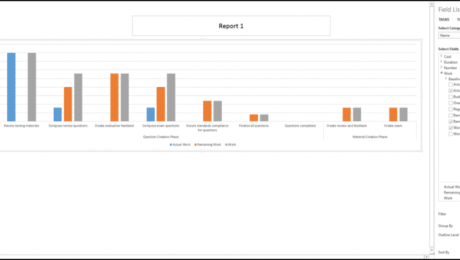
The Field List in Report Charts in Project: Video Lesson This video lesson, titled “Using the Field List with Report Charts,” shows how to use the Field List in report charts in Project. This video lesson is from our complete Project training, titled “Mastering Project Made Easy v.2013-2010.” The Field List in Report Charts
- Published in Latest, Microsoft, Project 2013
Changing a PivotTable in Microsoft Excel 2013
Tuesday, April 22 2014
Changing a PivotTable in Microsoft Excel 2013: Video This video shows changing a PivotTable in Excel 2013. Click here to view the complete tutorial Changing a PivotTable in Microsoft Excel 2013: Overview This lesson shows you ways to alter a PivotTable to change what data is displayed and calculated within the PivotTable. As was seen
- Published in Excel 2013, Latest
Formatting Charts in Crystal Reports 2013
Tuesday, February 25 2014
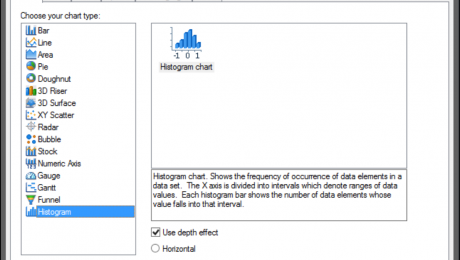
Editing Charts You can edit a chart object once it has been created, if needed. You can click the chart object once to select it and set the focus of the application to the chart object. It will appear with a blue border around its perimeter so that you can tell when it is selected.
- Published in Crystal Reports, Latest
- 1
- 2


